Gotop — When You Want Graphics in the Terminal
Familiar feeling when you need to quickly check server load, but there's no graphical interface? Standard utilities like top or htop provide information, but they often lack visual clarity. Gotop solves exactly this problem — a terminal resource monitor with a pseudo-graphical interface.
What is Gotop?
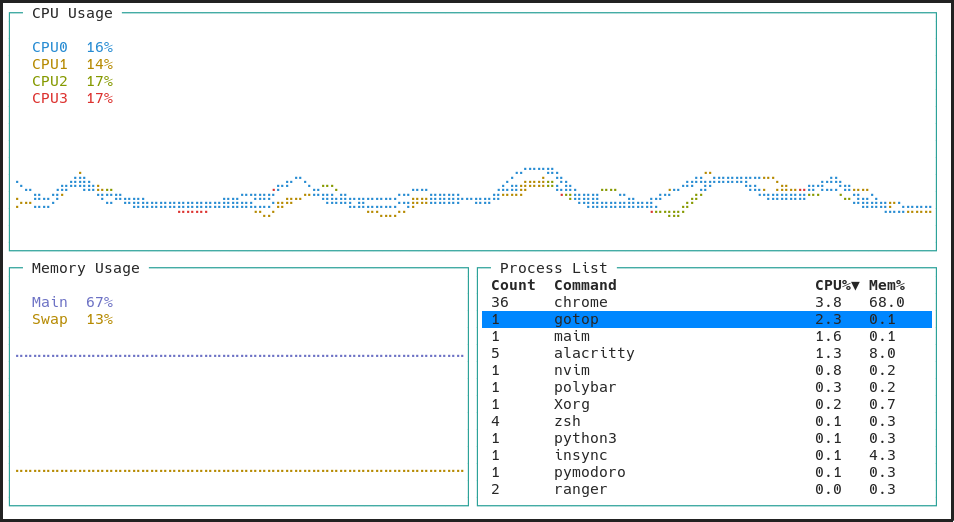
Gotop is a system resource monitoring tool inspired by gtop and vtop, but written in Go. It runs directly in the terminal, showing beautiful graphics of CPU load, memory usage, process list, and other useful information.
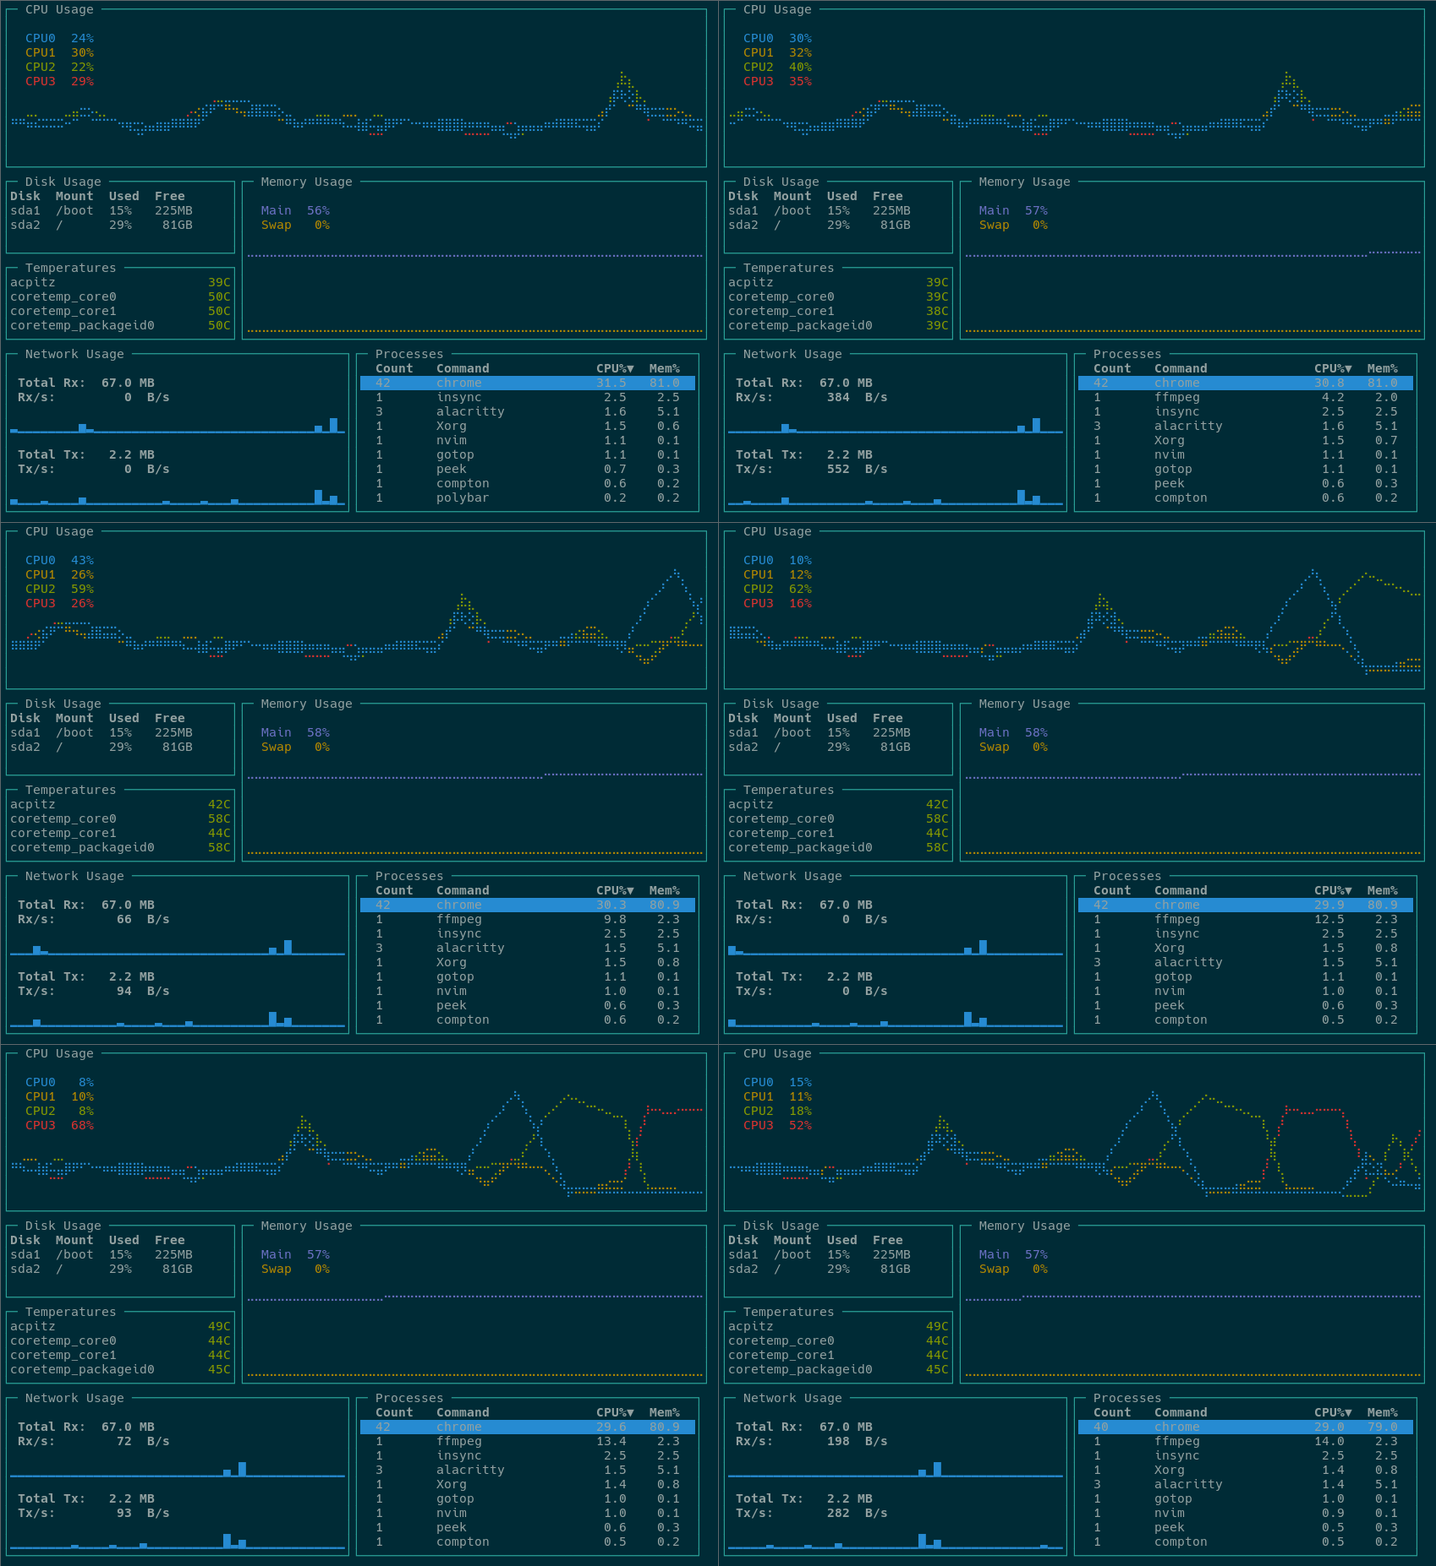
Although the original project is no longer maintained (the author recommends using the fork by xxxserxxx), gotop remains a popular solution with over 7.4k stars on GitHub.
Who is it for?
- System administrators
- DevOps engineers
- Developers working with resource-intensive applications
- Anyone who frequently works with servers without a GUI
Key Features
-
Clear real-time graphs:
- CPU load (overall and per core)
- RAM usage
- Network activity
- Battery level (for laptops)
-
Convenient process management:
- Sorting by CPU, memory, or PID
- Ability to terminate processes
- Grouping related processes
-
Flexible configuration:
- Multiple color schemes
- Ability to create custom themes
- Minimalist mode
- Refresh rate adjustment
How to Install
Gotop works on Linux, FreeBSD, and macOS. There are several installation methods:
For those who want to try it quickly:
git clone --depth 1 https://github.com/cjbassi/gotop /tmp/gotop
/tmp/gotop/scripts/download.sh
For Homebrew users:
brew tap cjbassi/gotop
brew install gotop
For Arch Linux (from AUR):
yay -S gotop-bin
Why Try It?
- Lightweight — works even on low-end machines
- Convenience — all information at a glance
- Flexibility — can be customized to your needs
- Beautiful interface — more pleasant to work with than standard
top
Technical Details
Gotop is written in Go and uses several interesting libraries:
- termui for building the interface
- gopsutil for collecting system information
- drawille-go for drawing charts
Practical Applications
- Performance debugging — you can immediately see which process is straining the system
- Server monitoring — convenient for tracking a remote machine's status
- Resource optimization — helps identify bottlenecks
Gotop is an excellent tool for those who want better visual clarity when working with system resources. Although the original project is no longer maintained, it's actively developed in forks, and the functionality remains in demand.
Try it if:
- You frequently work in the terminal
- You need convenient resource monitoring
- You want a beautiful and functional alternative to
top
What tools do you use for system monitoring?
Related projects